


How to Build a Reporting System That Works Across Different BI Tools
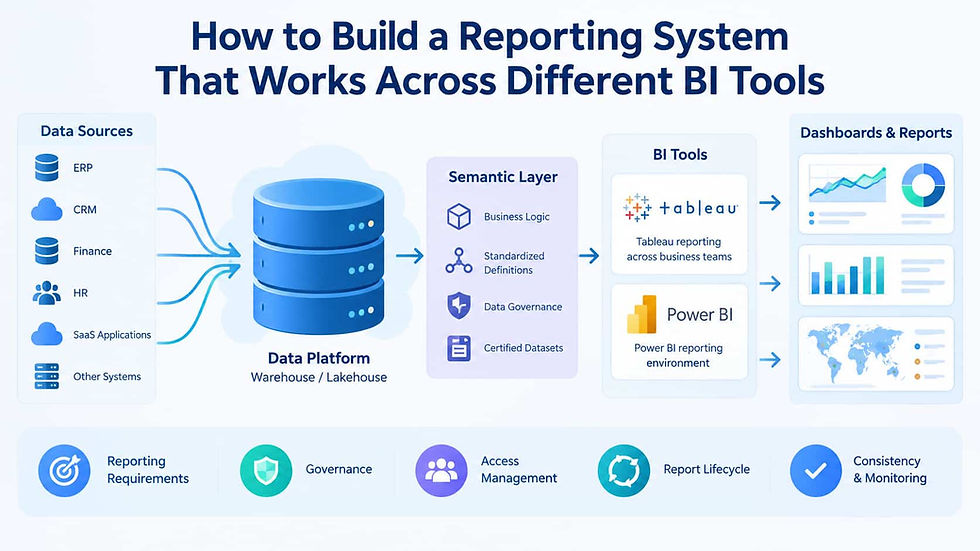
Companies rarely operate with a single reporting tool. Finance may rely on one platform, sales teams may prefer another, while operations, marketing, and management use dashboards built around their own workflows. This flexibility can support productivity, but it can also create conflicting metrics, duplicated data pipelines, and different versions of the same business report.
The solution is not necessarily to force every department onto one BI platform. A more sustainable approach is to build a reporting architecture in which different tools work from consistent data, definitions, governance rules, and access policies. Tableau and Power BI can both fit into such an environment without becoming the foundation of the architecture itself.
Start With a Shared Reporting Architecture
A multi-tool reporting environment should begin with the data layer rather than individual dashboards. The objective is to establish a reliable path from operational systems to reports, regardless of which BI application eventually presents the information.
A typical architecture can include several layers:
Source systems: ERP, CRM, finance applications, HR platforms, databases, SaaS applications, and operational software.
Integration layer: APIs, ETL or ELT pipelines, data integration services, and event-processing systems.
Central data platform: A data warehouse, lakehouse, or carefully governed combination of both.
Semantic and business logic layer: Standardized definitions for revenue, customers, orders, costs, margins, and other key measures.
BI layer: Tableau, Power BI, or other reporting tools used by different teams.
Consumption layer: Dashboards, scheduled reports, embedded analytics, and management summaries.
This separation prevents a dashboard tool from becoming the place where critical business logic is hidden. If a calculation exists only inside one report, another department may implement it differently in another BI platform.
The architecture should therefore make the data and definitions portable. BI tools become presentation and analysis layers rather than separate sources of business truth.
Standardize Data Before Standardizing Dashboards
Different BI tools can work with the same underlying datasets, but that does not automatically guarantee consistent results. Problems often arise because teams connect directly to different databases, apply different filters, or calculate the same metric independently.
A shared data model can reduce this risk.
For example, an organization might define a standard customer entity containing customer ID, region, segment, account status, and industry. Sales, finance, and customer-service dashboards can then use the same customer definitions even if their visualizations differ.
The same principle applies to measures. Terms such as "revenue," "active customer," "completed order," or "gross margin" should have documented definitions. Where calculations require exceptions, those rules should be explicitly recorded rather than embedded invisibly in individual dashboards.
A semantic layer can be particularly useful here. It gives teams reusable business definitions while allowing different BI applications to consume the same governed concepts.
This approach also makes Tableau reporting across business teams more manageable because Tableau dashboards can use standardized datasets rather than recreating business logic independently for every department.
Define Reporting Requirements Before Choosing Dashboard Designs
A common mistake is to begin with a request such as "we need a dashboard" without identifying the decision the dashboard needs to support.
Reporting requirements should describe:
Who will use the report?
What business decisions will it support?
Which metrics are required?
How frequently must the data be refreshed?
What level of detail is necessary?
Which historical periods should be available?
Who owns each metric?
Which users are allowed to see the information?
Is the report operational, analytical, or executive?
These questions help distinguish genuinely different requirements from superficial differences between departments.
For example, a sales manager may need daily pipeline information, while finance requires monthly revenue reconciliation. Both reports can rely on common customer and transaction data while using different aggregation rules and presentation formats.
Requirements should therefore be documented independently from the BI tool. This makes choosing an enterprise reporting approach a question of architecture, governance, and business needs rather than a decision based primarily on which application a particular department already prefers.
Let BI Tools Serve Different Use Cases
Once the underlying data architecture is stable, different BI platforms can coexist more effectively.
One department might use Tableau for interactive exploration and visual analytics, while another uses Power BI because it fits naturally into its existing Microsoft-oriented environment. Neither choice has to determine how the organization's core data is structured.
For example, a governed sales dataset could feed both a Tableau executive dashboard and a Power BI operational report. The visuals may differ, but core measures such as bookings, revenue, customer count, and sales pipeline should remain aligned.
A Power BI reporting environment can therefore operate alongside other BI platforms without becoming an isolated reporting ecosystem. The important requirement is that each platform connects to approved datasets and follows common definitions.
Organizations should also avoid unnecessary duplication. If five teams need essentially the same information, building five independent data models creates long-term maintenance costs. A shared dataset or semantic model can provide the foundation, while dashboards remain tailored to individual audiences.
Establish Governance Without Blocking Self-Service
Governance is essential in a multi-tool reporting environment, but excessive centralization can make analytics slow and frustrating for business users.
A practical governance model separates centrally controlled elements from areas where teams can work independently.
Central governance should normally cover:
Core business definitions
Authoritative datasets
Data ownership
Security classifications
Access policies
Data quality standards
Refresh requirements
Regulatory and privacy controls
Business teams can retain greater freedom over dashboard layouts, visualizations, filters, and exploratory analysis.
A data catalog can help users understand which datasets are approved, who owns them, how frequently they are updated, and what each important field means. Certification labels can distinguish trusted enterprise datasets from experimental or departmental data.
This balance allows self-service analytics without creating an uncontrolled collection of competing reports.
Design Access Around Data, Not Just Reports
Access management becomes more complicated when several BI tools are involved. Granting access separately inside every dashboard can produce inconsistent permissions and significant administrative overhead.
Where possible, organizations should establish access around shared identities, groups, roles, and data-level policies.
For example, regional sales managers may be assigned access to their geographic data through an enterprise identity group. The same principle can then be applied when that information is consumed through different BI applications.
Row-level security can further restrict which records individual users can view. Sensitive financial, customer, employee, or operational information should be protected at the data layer whenever practical.
This approach is particularly important for cross-department reporting and dashboards, where users from different functions may need access to shared metrics but should not automatically receive access to every underlying record.
Create a Lifecycle for Reports and Dashboards
A reporting system should also define what happens after a dashboard is created.
Without a lifecycle, organizations gradually accumulate hundreds or thousands of reports, many of which have overlapping purposes or outdated data.
A simple lifecycle can include:
Request: A business team identifies a reporting requirement.
Assessment: The organization checks whether an existing dataset or report already satisfies the need.
Development: The report is created using approved data sources and definitions.
Validation: Business owners verify calculations and results.
Publication: The dashboard receives appropriate ownership, documentation, and access controls.
Monitoring: Usage, refreshes, data quality, and technical performance are tracked.
Review: Low-value or obsolete reports are archived or removed.
Report ownership should be explicit. Every important dashboard should have both a business owner responsible for its meaning and, where appropriate, a technical owner responsible for its implementation.
Monitor Consistency Across Platforms
A multi-BI strategy requires ongoing validation. Even when multiple tools use the same source data, differences can emerge because of filters, refresh schedules, joins, calculated fields, or implementation details.
Organizations should periodically compare important metrics across platforms. Automated data-quality tests can verify source data, while reconciliation processes can identify differences in key reports.
It is also useful to maintain a small set of authoritative enterprise metrics that receive additional monitoring. If revenue in a Power BI dashboard differs from revenue in a Tableau executive report, users need a clear process for determining which calculation is correct and why.
The goal is not to make every dashboard visually identical. The goal is to make important business facts consistent.
Conclusion
Building a reporting system that works across different BI tools requires the organization to treat BI applications as part of a broader architecture rather than as independent reporting worlds. Shared data sources, standardized definitions, clear requirements, centralized governance, role-based access, and defined report lifecycles create the foundation.
Tableau, Power BI, and other platforms can then serve different teams and use cases without creating competing versions of business reality. The most important investment is not choosing a single visualization tool, but establishing the data and governance structures that allow multiple tools to operate consistently.
When that foundation is in place, organizations can support departmental flexibility while maintaining reliable enterprise reporting. Teams get the tools they need, while management gains greater confidence that different dashboards are ultimately working from the same underlying business information.
Comments